dcmri.shepp_logan#
- dcmri.shepp_logan(*params, n=256, B0=3)[source]#
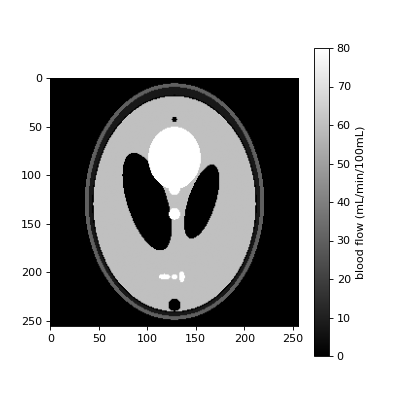
Modified Shepp-Logan phantom mimicking an axial slice through the brain.
The phantom is based on an MRI adaptation of the Shepp-Logan phantom (Gach et al 2008), but with added features for use in a DC-MRI setting: (1) additional regions for anterior cerebral artery and sinus sagittalis; (2) additional optional contrasts blood flow (BF), blood volume (BV), permeability-surface area product (PS) and interstitial volume (IV).
- Parameters:
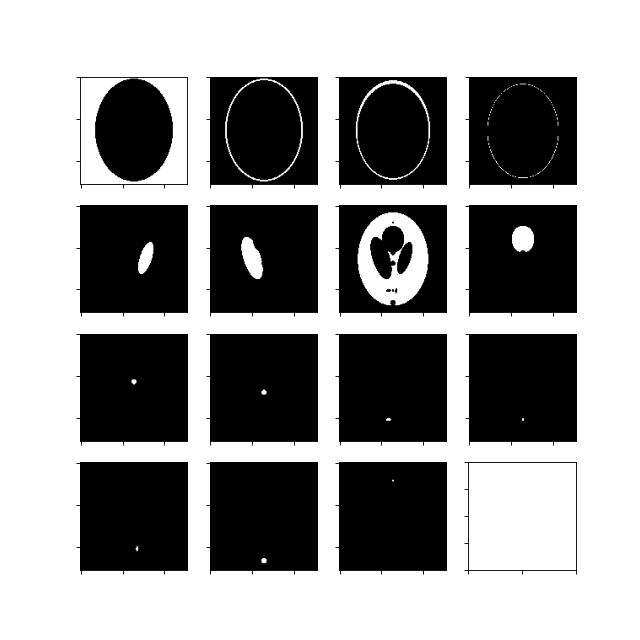
params (str or tuple) – parameter or parameters shown in the image. The options are ‘PD’ (proton density), ‘T1’, ‘T2’, ‘Fb’ (blood flow), ‘vb’ (Blood volume), ‘PS’ (permeability-surface area product) and ‘vi’ (interstitial volume). If no parameters are provided, the function returns a dictionary with 14 masks, one for each region.
n (int, optional) – matrix size. Defaults to 256.
B0 (int, optional) – field strength in T. Defaults to 3.
- Reference:
H. M. Gach, C. Tanase and F. Boada, “2D & 3D Shepp-Logan Phantom Standards for MRI,” 2008 19th International Conference on Systems Engineering, Las Vegas, NV, USA, 2008, pp. 521-526, doi 10.1109/ICSEng.2008.15.
- Returns:
if only one parameter is provided, this returns an array. In all other conditions this returns a dictionary where keys are the parameter- or region names, and values are square arrays with image values.
- Return type:
numpy.array or dict
Note
- Mask names:
background
scalp
bone
CSF skull
CSF left
CSF right
gray matter
tumor 1 to tumor 6
sagittal sinus
anterior artery
Example:
Generate a single contrast:
>>> import matplotlib.pyplot as plt
>>> import dcmri as dc
Simulate a synthetic blood flow image:
>>> im = dc.shepp_logan('Fb')
Plot the result in units of mL/min/100mL:
>>> fig, ax = plt.subplots(figsize=(5, 5), ncols=1)
>>> pos = ax.imshow(6000*im, cmap='gray', vmin=0.0, vmax=80)
>>> fig.colorbar(pos, ax=ax, label='blood flow (mL/min/100mL)')
>>> plt.show()
(
Source code,png,hires.png,pdf)
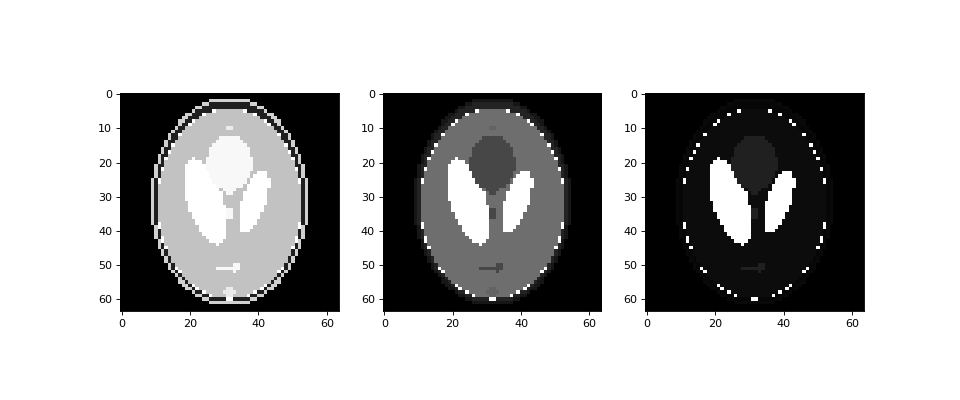
Generate multiple contrasts in one function call:
>>> import matplotlib.pyplot as plt
>>> import dcmri as dc
Generate the MR Shepp-Logan phantom in low resolution:
>>> im = dc.shepp_logan('PD', 'T1', 'T2', n=64)
Plot the result:
>>> fig, (ax1, ax2, ax3) = plt.subplots(figsize=(12, 5), ncols=3)
>>> ax1.imshow(im['PD'], cmap='gray')
>>> ax2.imshow(im['T1'], cmap='gray')
>>> ax3.imshow(im['T2'], cmap='gray')
>>> plt.show()
(
Source code,png,hires.png,pdf)
Generate masks for the different regions-of-interest:
>>> import matplotlib.pyplot as plt
>>> import dcmri as dc
Generate the MR Shepp-Logan phantom masks:
>>> im = dc.shepp_logan(n=128)
Plot all masks:
>>> fig, ax = plt.subplots(figsize=(8, 8), ncols=4, nrows=4)
>>> ax[0,0].imshow(im['background'], cmap='gray')
>>> ax[0,1].imshow(im['scalp'], cmap='gray')
>>> ax[0,2].imshow(im['bone'], cmap='gray')
>>> ax[0,3].imshow(im['CSF skull'], cmap='gray')
>>> ax[1,0].imshow(im['CSF left'], cmap='gray')
>>> ax[1,1].imshow(im['CSF right'], cmap='gray')
>>> ax[1,2].imshow(im['gray matter'], cmap='gray')
>>> ax[1,3].imshow(im['tumor 1'], cmap='gray')
>>> ax[2,0].imshow(im['tumor 2'], cmap='gray')
>>> ax[2,1].imshow(im['tumor 3'], cmap='gray')
>>> ax[2,2].imshow(im['tumor 4'], cmap='gray')
>>> ax[2,3].imshow(im['tumor 5'], cmap='gray')
>>> ax[3,0].imshow(im['tumor 6'], cmap='gray')
>>> ax[3,1].imshow(im['sagittal sinus'], cmap='gray')
>>> ax[3,2].imshow(im['anterior artery'], cmap='gray')
>>> for i in range(4):
>>>     for j in range(4):
>>>         ax[i,j].set_yticklabels([])
>>>         ax[i,j].set_xticklabels([])
>>> plt.show()
(
Source code,png,hires.png,pdf)
