dcmri.fake_brain#
- dcmri.fake_brain(n=192, tacq=180.0, dt=1.5, BAT=20, Tav=8, field_strength=3.0, agent='gadodiamide', H=0.45, R10a=0.614, S0=150, model='SS', TR=0.005, FA=15, TC=0.2, CNR=inf, dt_sim=0.1, verbose=0)[source]#
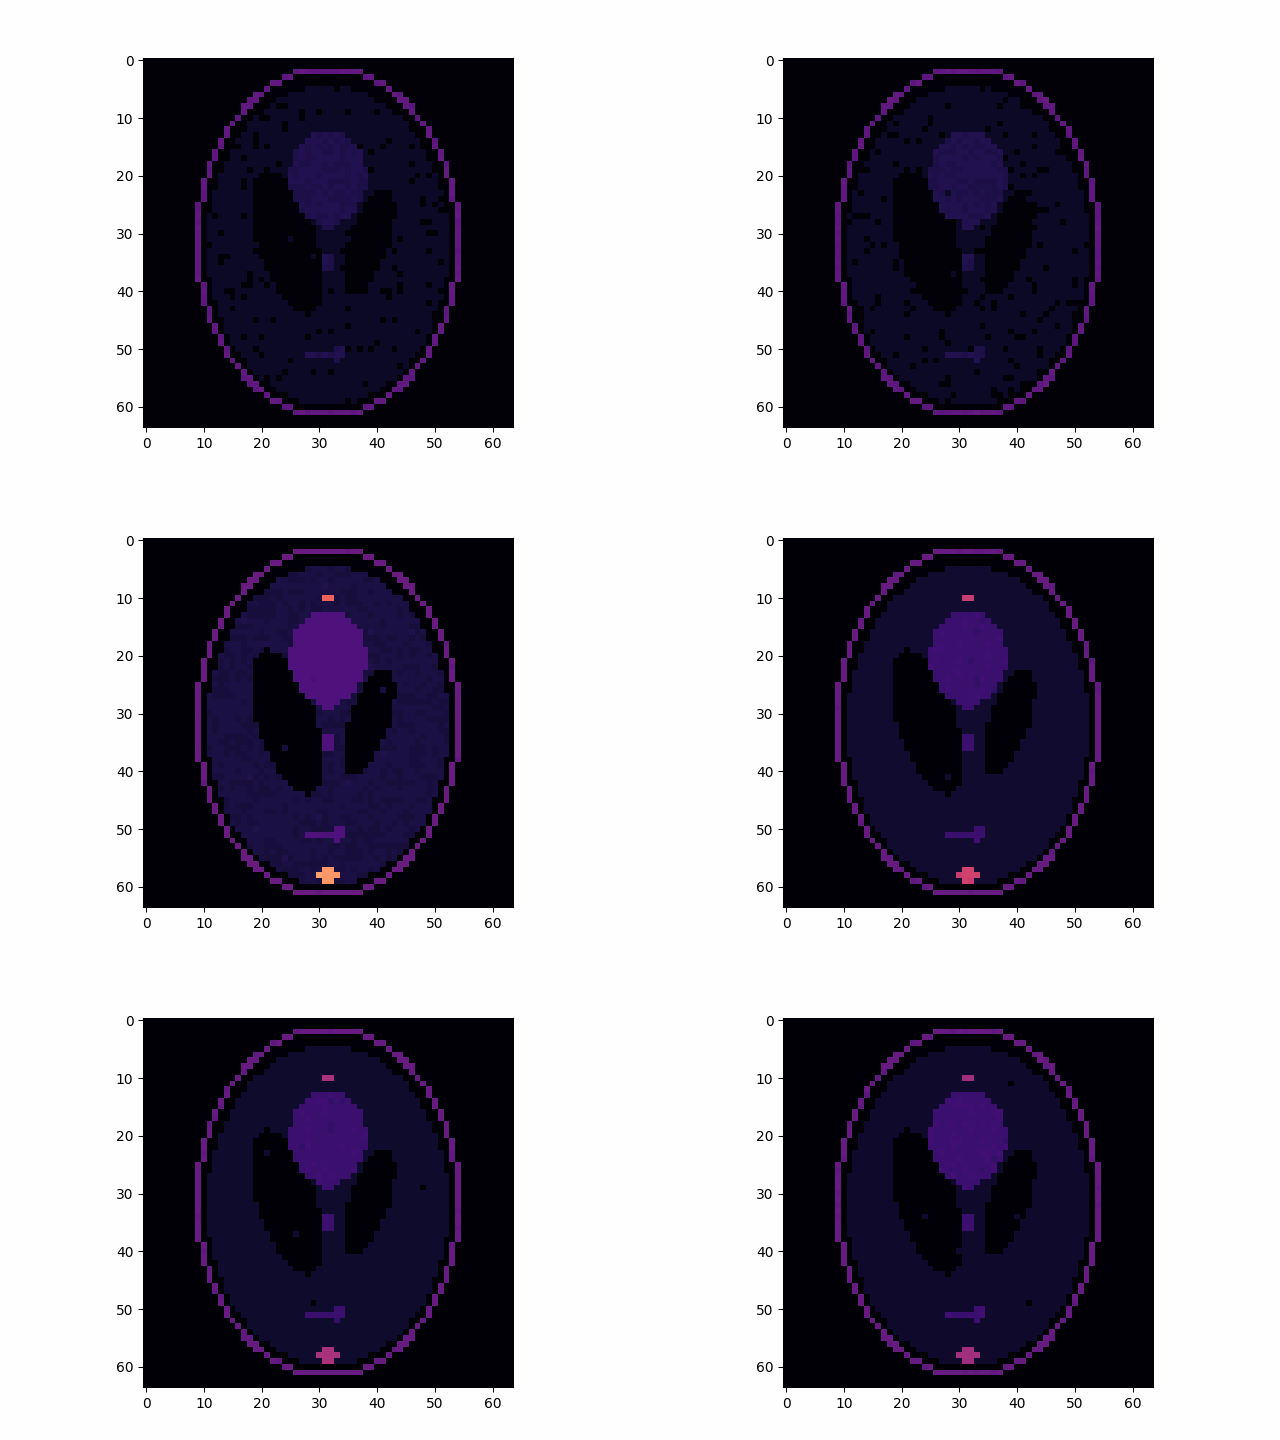
Synthetic brain images data generated using Parker’s AIF, the Shepp-Logan phantom and a two-compartment exchange tissue.
- Parameters:
n (int, optional) – matrix size. Defaults to 192.
tacq (float, optional) – Duration of the acquisition in sec. Defaults to 180.
dt (float, optional) – Sampling inteval in sec. Defaults to 1.5.
BAT (int, optional) – Bolus arrival time in sec. Defaults to 20.
Tav (float, optional) – Arterio-venous transit time. Defaults to 8 sec.
field_strength (float, optional) – B0 field in T. Defaults to 3.0.
agent (str, optional) – Contrast agent generic name. Defaults to ‘gadodiamide’.
H (float, optional) – Hematocrit. Defaults to 0.45.
R10a (_type_, optional) – Precontrast relaxation rate for blood in 1/sec. Defaults to 1/dc.T1(3.0, ‘blood’).
S0 (int, optional) – Signal scaling factor for tissue (arbitrary units). Defaults to 150.
model (str, optional) – Scanning sequences, either steady-state (‘SS’) or saturation-recovery (‘SR’)
TR (float, optional) – Repetition time in sec. Defaults to 0.005.
FA (int, optional) – Flip angle. Defaults to 20.
TC (float, optional) – time to center of k-space in SR sequence. This is ignored when sequence=’SS’. efaults to 0.2 sec.
CNR (float, optional) – Contrast-to-noise ratio, define as the ratio of signal-enhancement in the AIF to noise. Defaults to np.inf.
dt_sim (float, optional) – Sampling inteval of the forward modelling in sec. Defaults to 0.1.
verbose (int, optional) – if set to 0, no feedback is given during the computation. With verbose=1, an progress bar is shown. Defaults to 0.
- Returns:
time, signal, gt
time: array of time points.
signal: 3D array of pixel sigals, with dimensions (x,y,t).
gt: dictionary with ground truth values for concentrations and tissue parameters.
- Return type:
Example
>>> import matplotlib.pyplot as plt
>>> from matplotlib.animation import ArtistAnimation
>>> import dcmri as dc
Generate data:
>>> time, signal, aif, gt = dc.fake_brain(n=64, CNR=100)
Display as animation:
>>> fig, ax = plt.subplots()
>>> ims = []
>>> for i in range(time.size):
>>>     im = ax.imshow(signal[:,:,i], cmap='magma', animated=True, vmin=0, vmax=30)
>>>     ims.append([im])
>>> ani = ArtistAnimation(
>>>     fig, ims, interval=50, blit=True,
>>>     repeat_delay=0)
>>> plt.show()

