dcmri.relax_tissue#
- dcmri.relax_tissue(ca: ndarray, R10: float, r1: float, t=None, dt=1.0, kinetics='2CX', water_exchange='FF', **params)[source]#
Free relaxation rates for a 2-site exchange tissue. For more detail see Exchange tissues.
Note: the free relaxation rates are the relaxation rates of the tissue compartments in the absence of water exchange between them.
- Parameters:
ca (array-like) – concentration in the blood of the arterial input.
R10 (float) – precontrast relaxation rate. The tissue is assumed to be in fast exchange before injection of contrast agent.
r1 (float) – contrast agent relaxivity.
t (array_like, optional) – the time points in sec of the input function ca. If t is not provided, the time points are assumed to be uniformly spaced with spacing dt. Defaults to None.
dt (float, optional) – spacing in seconds between time points for uniformly spaced time points. This parameter is ignored if t is explicity provided. Defaults to 1.0.
kinetics (str, optional) – Tracer-kinetic model. Possible values are ‘2CX’, ‘2CU’, ‘HF’, ‘HFU’, ‘NX’, ‘FX’, ‘WV’, ‘U’. Defaults to ‘2CX’.
water_exchange (str, optional) – Water exchange regime, Any combination of two of the letters ‘F’, ‘N’, ‘R’ is allowed. Defaults to ‘FF’.
params (dict) – values for the parameters of the tissue, specified as keyword parameters. See table Parameters by configuration for more detail on the parameters that are relevant in each regime.
- Returns:
- relaxation rates
In the fast water exchange limit, the relaxation rates are a 1D array. In all other situations, relaxation rates are a 2D-array with dimensions (k,n), where k is the number of compartments and n is the number of time points in ca.
- volume fractions
the volume fractions of the tissue compartments. Returns None in ‘FF’ regime.
- water flows
2D array with water exchange rates between tissue compartments. Returns None in ‘FF’ regime.
- Return type:
Example
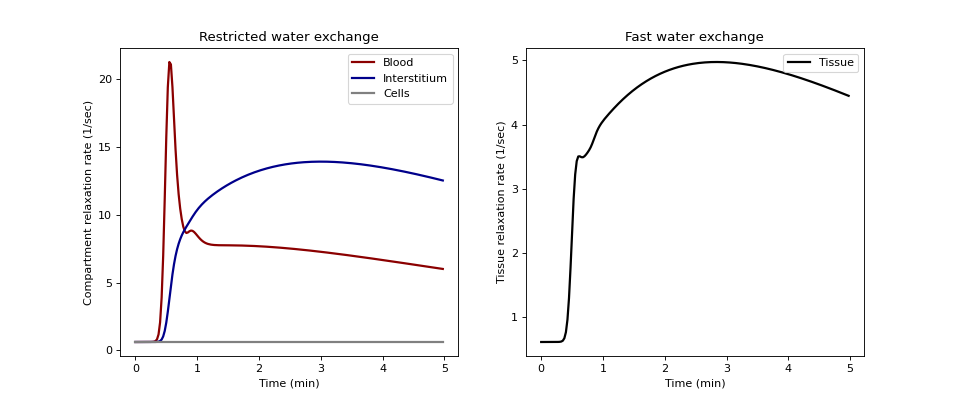
Compare the free relaxation rates without water exchange against relaxation rates in fast exchange:
>>> import matplotlib.pyplot as plt
>>> import numpy as np
>>> import dcmri as dc
Generate a population-average input function:
>>> t = np.arange(0, 300, 1.5)
>>> ca = dc.aif_parker(t, BAT=20)
Define constants and model parameters:
>>> R10, r1 = 1/dc.T1(), dc.relaxivity()
>>> pf = {'H':0.5, 'vb':0.05, 'vi':0.3, 'Fb':0.01, 'PS':0.005}
>>> pn = {'H':0.5, 'vb':0.1, 'vi':0.3, 'Fb':0.01, 'PS':0.005}
Calculate tissue relaxation rates without water exchange, and also in the fast exchange limit for comparison:
>>> R1f, _, _ = dc.relax_tissue(ca, R10, r1, t=t, water_exchange='FF', **pf)
>>> R1n, _, _ = dc.relax_tissue(ca, R10, r1, t=t, water_exchange='NN', **pn)
Plot the relaxation rates in the three compartments, and compare against the fast exchange result:
>>> fig, (ax0, ax1) = plt.subplots(1,2,figsize=(12,5))
Plot restricted water exchange in the left panel:
>>> ax0.set_title('Restricted water exchange')
>>> ax0.plot(t/60, R1n[0,:], linestyle='-',
>>>          linewidth=2.0, color='darkred', label='Blood')
>>> ax0.plot(t/60, R1n[1,:], linestyle='-',
>>>          linewidth=2.0, color='darkblue', label='Interstitium')
>>> ax0.plot(t/60, R1n[2,:], linestyle='-',
>>>          linewidth=2.0, color='grey', label='Cells')
>>> ax0.set_xlabel('Time (min)')
>>> ax0.set_ylabel('Compartment relaxation rate (1/sec)')
>>> ax0.legend()
Plot fast water exchange in the right panel:
>>> ax1.set_title('Fast water exchange')
>>> ax1.plot(t/60, R1f, linestyle='-',
>>>          linewidth=2.0, color='black', label='Tissue')
>>> ax1.set_xlabel('Time (min)')
>>> ax1.set_ylabel('Tissue relaxation rate (1/sec)')
>>> ax1.legend()
>>> plt.show()
(
Source code,png,hires.png,pdf)
